
You can now optionally ask or allow respondents identifying map points on questions forms to provide more than one point.
Contents
Background
Custom form fields include a map where the respondent can click to select a point. While any form that offers custom fields can include a map, this is only really useful in the questions form type.
Previously you could only choose between an optional or mandatory point selection.
Adding a map
You can now ask the respondent for any number of points between a chosen minimum and maximum number. So you can require exactly 3 points, say. Or you could allow any between 0 and 4, which means the response is optional and can consist of up to 4 points. You can require a single point as before with a minimum and maximum of one. You can ask for an optional single response as before with a minimum of zero and maximum of one.
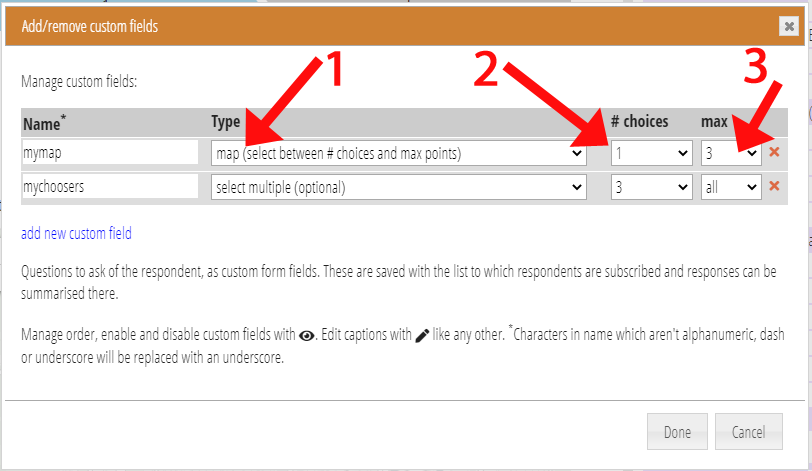
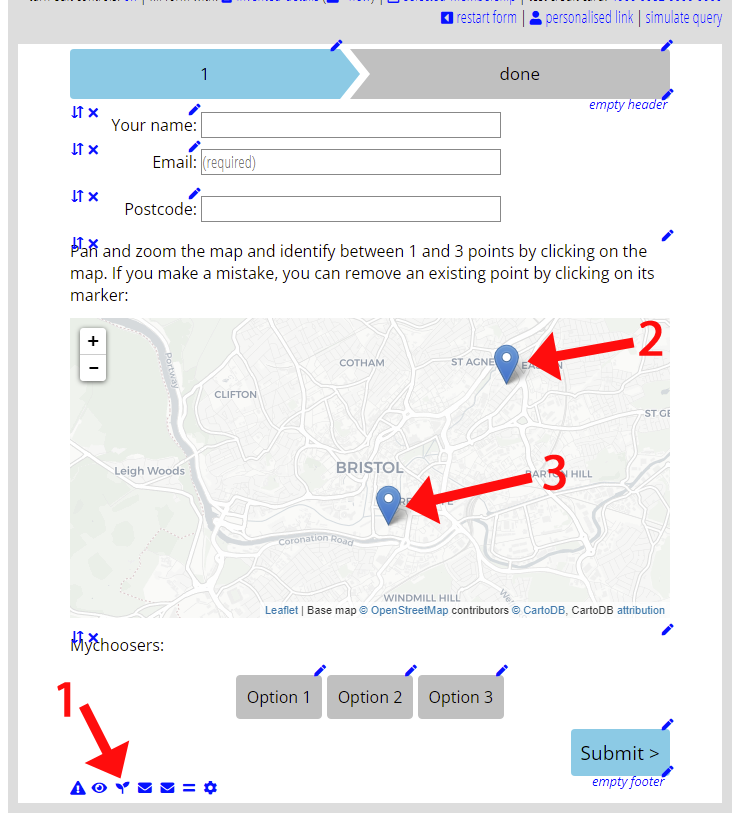
As before, include a map by adding it as a custom field, using the seedling icon (![]() Fig 2: 1). There were two map choices previously for optional and mandatory. Now, there is just one (Fig 1: 1). When you select it, you can then choose the minimum (Fig 1: 2) and maximum number of points (Fig 1: 3; n/a means optional/zero, and all for maximum means unlimited selections for a map). The selection is very similar to multiple choice answers.
Fig 2: 1). There were two map choices previously for optional and mandatory. Now, there is just one (Fig 1: 1). When you select it, you can then choose the minimum (Fig 1: 2) and maximum number of points (Fig 1: 3; n/a means optional/zero, and all for maximum means unlimited selections for a map). The selection is very similar to multiple choice answers.
Map interaction
If you chose a maximum of one point, the map works the same: click to show a marker, click again moves the marker to the new location.
When you allow more than one, however, an additional click adds a further marker (Fig 2: 3). Once they reach the maximum allowed, additional clicks do nothing.
In both cases, we now remove the marker if they click on it. That allows them to correct mistaken clicks when they have multiple markers.
As before, if they try to submit the form with too few points, they get an error message. Previously, too few could only mean zero when the map was a mandatory question; now it happens when they haven’t added your chosen minimum. Because of this the we phrase the error message a bit differently.
Viewing responses
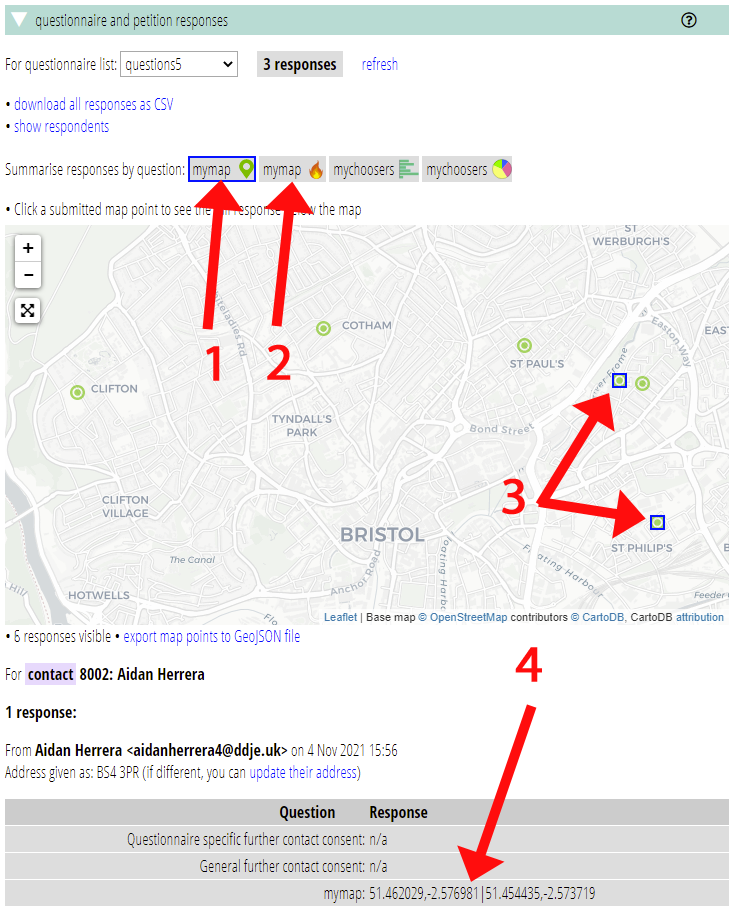
As before, Cameo summarises a respondent’s map answers on a map in member info → questionnaire and petition responses, either a point plot (Fig 3: 1) or a heat map (Fig 3: 2). If they provided multiple points, you will see them all (Fig 3: 3). That is not really different to filling in the questionnaire multiple times. This is also the case if you export the map as a GeoJSON file.
When you select a respondent, the individual answers now show multiple latitude/longitude pairs, separated by a vertical bar. For example 52.384,0.186|52.669,-0.367 (Fig 3: 4). This is very similar to multiple answers to a multiple choice question where the responses are also separated by a vertical bar.
That also applies when you export the results as a spreadsheet.