- Cameo’s questions form (for petitions, surveys, consultations, questionnaires and applications) now has an option to show the number of responses received so far, as a number or a bar
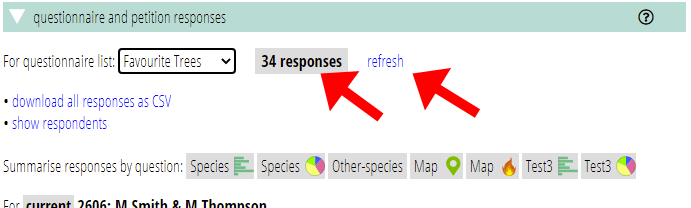
- member info → questionnaire and petition responses now prominently includes the number of responses from a form
- map responses can now be displayed as a heat map as well as individual point plots
- the number of responses plotted on the area of the map you can currently see is shown underneath the map
- maps now allow respondents to provide multiple points (see separate article)
Contents
Display responses received
The questions form options (![]() ) now includes show number of responses received so far. Selecting that provides a text block so you can phrase and format it as you wish. When you edit it, using the pencil icon (
) now includes show number of responses received so far. Selecting that provides a text block so you can phrase and format it as you wish. When you edit it, using the pencil icon (![]() ) like any other text in a form, it offers three substitutions:
) like any other text in a form, it offers three substitutions:
- {RESPONSES}, the count of responses received so far
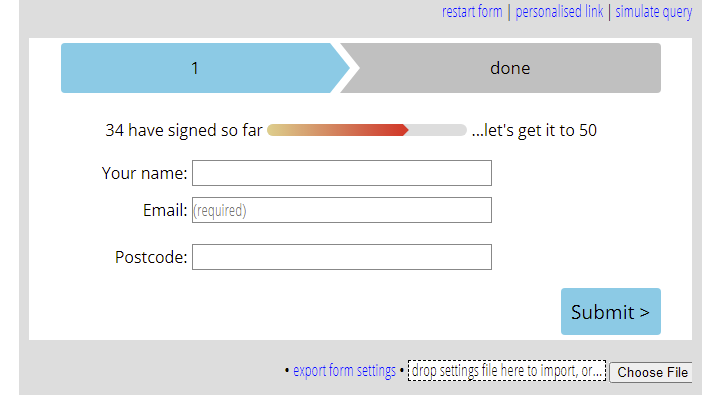
- {BAR} which presents this as a bar, as many petitions web sites do, relative to some (arbitrary) threshold. BAR behaves like a very wide single character so far as formatting is concerned. If you want to customise this further, the colours etc. are all controlled by CSS which you can override.
- {THRESHOLD} which is that number. Threshold goes 50, 100, 250, 500, 1000, … as a target incentive
This lets you achieve results like that shown in Fig 1.
Questionnaire and petition responses
Responses received
member info → questionnaire and petition responses now also prominently includes the number of responses from a form (Fig 2), along with a refresh button.
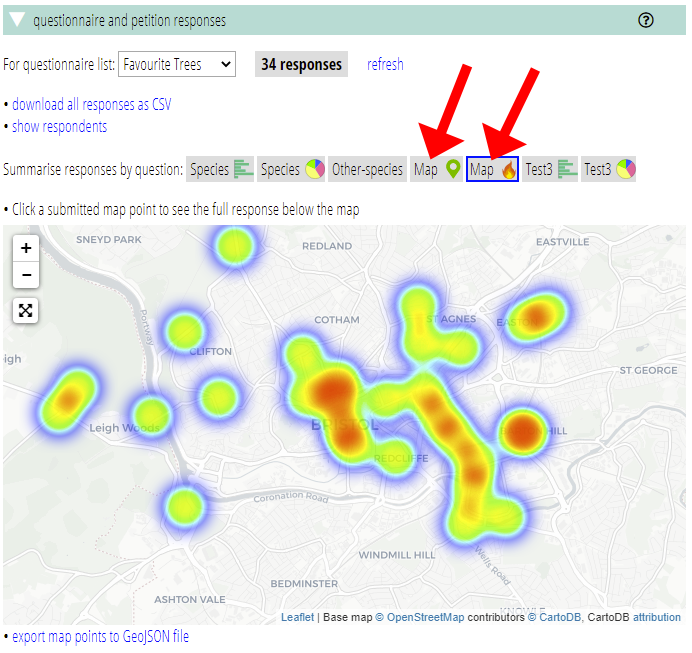
Heat map
By way of experiment, you can now display points derived from a map in your questions form on a heat map. Like multiple choice answers where you can choose a bar graph or pie chart, Cameo offers two buttons for map questions, distinguished by icons. These select the map lot as before, and the new heat map presentation (Fig 3).
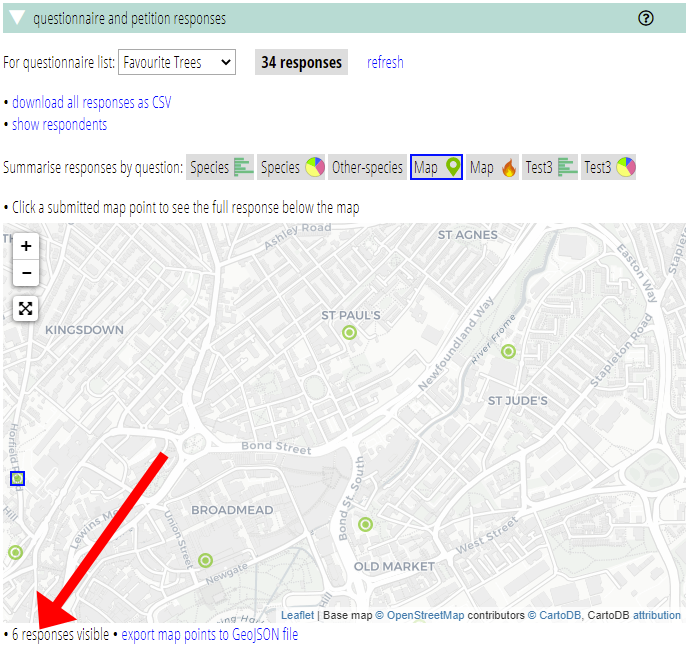
Number of points plotted
In the points plot map, as you pan and zoom, Cameo shows have many points are visible in your map area. This helps clarify when there are nearly-coincident points, which can happen when there are many responses (Fig 4).